Background Information
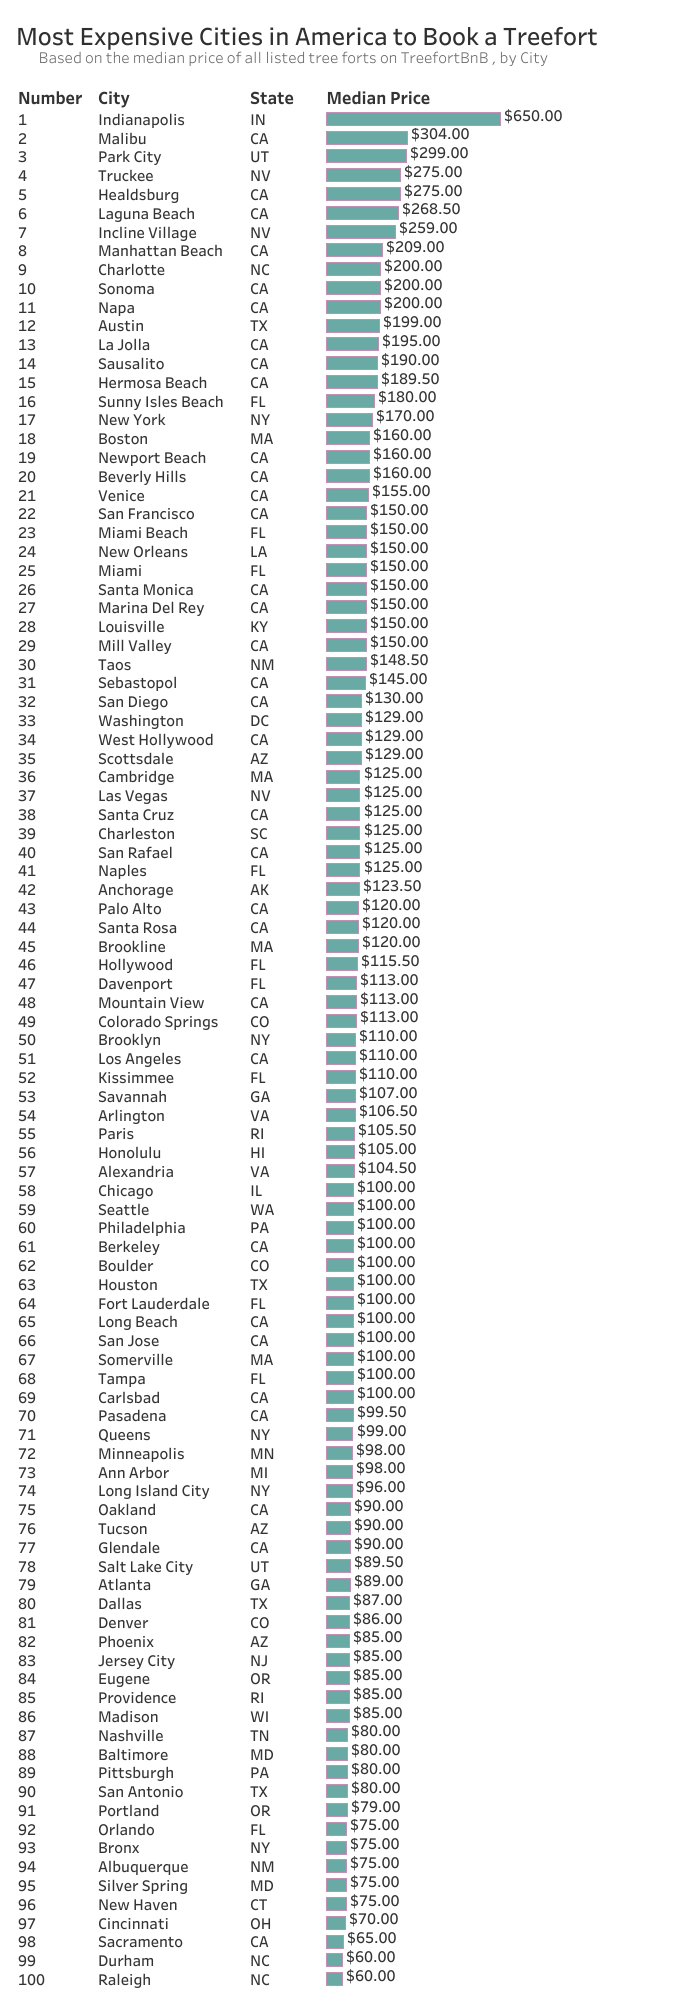
I found an interesting puzzle on Priceonomics, and thought that it would be a fun way to practice using R to manipulate datasets. This puzzle is based around an imaginary company, TreefortBnb, that has capitalized on the niche treefort rental market. TreefortBnb has basic data for each of the tree forts listed on their website and Priceonomics has scraped TreefortBnb.com in order to obtain the following data points: unique id, city, state, price, reviews. Using this data, Priceonomics wants you to provide them with a data table that lists the top 100 cities, by total number of tree forts, ordered by highest median price.
Source Dataset Location: Original Dataset
Descriptive Markdown File: treefortbnb.md
Tip: If the above download link doesn't work for you, try to open the file in your browser instead by using this link.
Data Clean-Up
When we review the list of cities using unique(data[‘City’]), we can see that the cases of city names are not entered in a consistent manner. Most of the cities entries have the first letter capitalized (referred to as “title case”) but a couple city entries are in lowercase and one is in uppercase. In order to solve this issue, I decided to make all city names lowercase and change them back to title case at the end. In hindsight, it would be more efficient to change all city entries to title case at the start of the project instead but that is not how I solved the puzzle.
In addition, by using sort(unique(paste(data[[‘City’]],data[[‘State’]]))), we can see that there are several cities of the same name in different states (Example: Berkeley, CA & Berkeley, CO). In order to solve this issue, we can concatenate the city and state together in the city column in order to ensure we are aggregating only the correct treefort entries.
Detailed Solution
For a detailed, step by step solution, download the treefortbnb.md markdown file at the top of the page and input the text into a markdown reader such as dillinger.io. If the download link does not work for you, try to open the file in your browser instead by using this link.
Brief Summary
In order to solve this puzzle, we must first load the data, and the dplyr and tools packages, into R. After loading everything we need, we will convert all cities to lowercase and concatenate the cities and their respective states. Then, we will perform a count of the number of treeforts in each city and limit our data to only the top 100 cities by number of treeforts -- this will give us our list of top 100 cities by number of treeforts. Next, we will use an aggregate function to solve for the median price of all treeforts in every city and then use an inner join to combine our two objects: a list of 100 cities by number of treeforts, and the median price of treeforts in every city. After using an inner join, we order the resulting object by descending median price and then clean up our data.