Background Information
SMART, or Sonoma Marin Area Rail Transit, is a public transportation system in the North Bay Area that connects Sonoma and Marin counties. SMART began to operate passenger trains in July 2017 and, as of April 2020, provides service between Santa Rosa (Northern terminus) and Larkspur (Southern terminus).
SMART, like other public transportation systems, relies on public funding to cover the gap between revenue and costs. Earlier this year, SMART unsuccessfully attempted to pass a tax measure in the North Bay, Measure I, in order to extend the current quarter-cent SMART sales tax by an additional 30 years. In the weeks leading up to voting day, I remember hearing dozens of political ads on the radio and seeing many lawn signs propped up around my hometown of Windsor. As someone who has spent almost their entire life in the North Bay, I never really gave much thought to the SMART system and have only used it once. The polarizing rhetoric around Measure I inspired me to learn more about SMART by analyzing the publically available data and searching for interesting trends. The focus of this data exploration project will be on ridership, specifically, and not on the economic or fiscal issues associated with the SMART public transportation system.
Google Sheets Document: smart_ridership.xlsx
Topic Outline
1. Trends: Train Time & Direction Data
a. Primary Commute Pattern
b. Unequal Ridership by Direction
2. Trends: Daily Ridership Count Data
a. Ridership by Day
b. Ridership by Season
c. Ridership by Adjusted Year
3. Project Summary
Trends: Train Time & Direction Data
Primary Commute Pattern
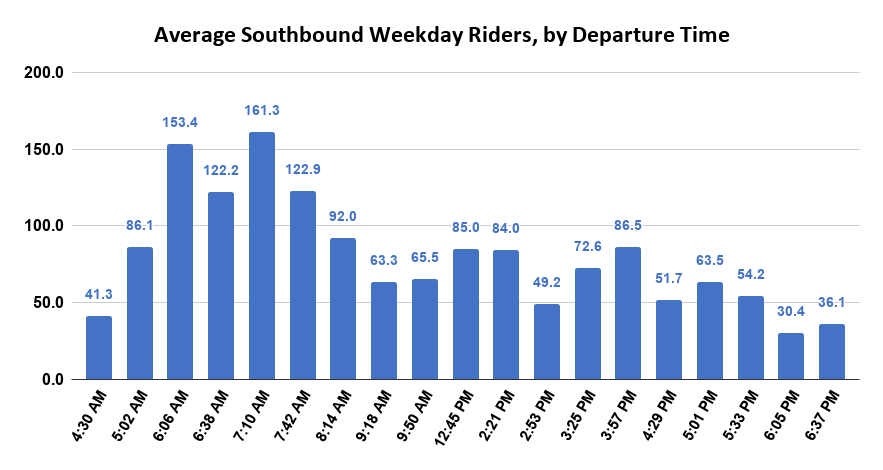
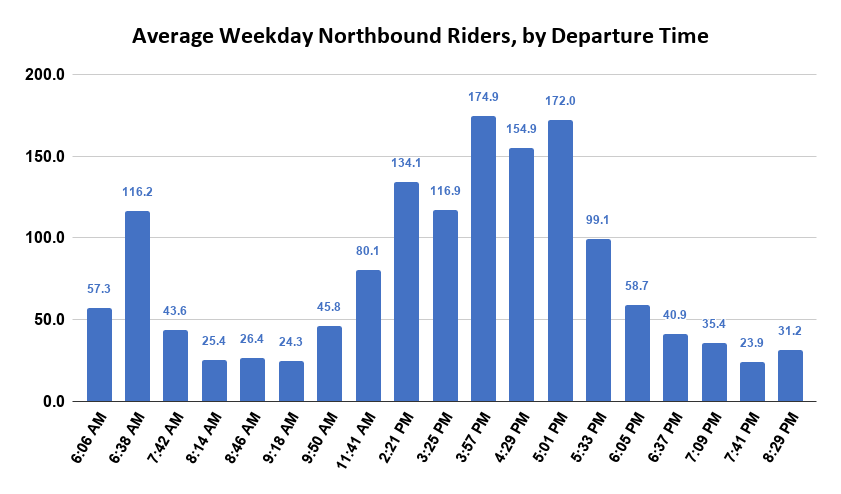
The most prevalent weekday commute pattern seems to be Southbound in the morning and Northbound in the evening. There are approximately 2.2x the amount of Southbound AM riders as compared to Northbound AM rides (18158 Southbound vs 8377 Northbound). When we make the same comparison for PM riders, we see that there are approximately 1.7x the amount of Northbound PM riders as Southbound PM riders (20838 Northbound vs 12255 Southbound). The five most popular train times, based on highest number of average riders in February, are all part of this generalized commute pattern: Northbound 3:57 PM (174.9), Northbound 5:01 PM (172.0), Southbound 7:10 AM (161.3), Northbound 4:29 PM (154.9), and Southbound 6:06 AM (153.4).
Unequal Ridership by Direction
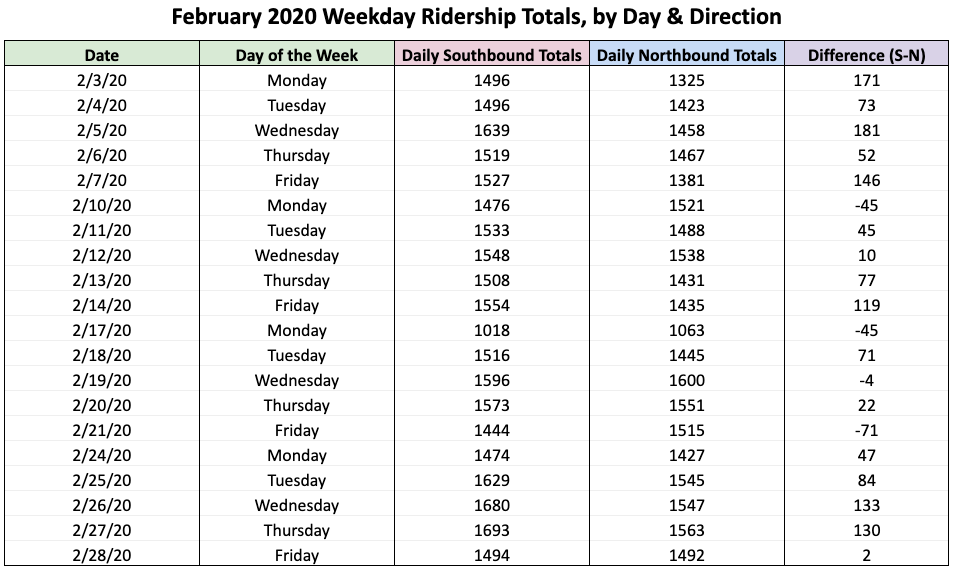
When we compare the total number of weekday Northbound riders with the total number of weekday Southbound riders for each day, we notice two things: the amount of riders in each direction don’t match up exactly and it is more likely that a random day has more Southbound riders than Northbound riders. Out of the twenty weekdays in February, sixteen had more Southbound riders than Northbound riders and four had more Northbound riders than Southbound riders.
Trends: Daily Ridership Count Data
Ridership by Day
Ordering the days of the week, by average daily riders on SMART, gives us: Thursday (2424.7), Friday (2424.5), Wednesday (2420.5), Tuesday (2388.5), Monday (2169.9), Saturday (1138.2) and Sunday (982.6).
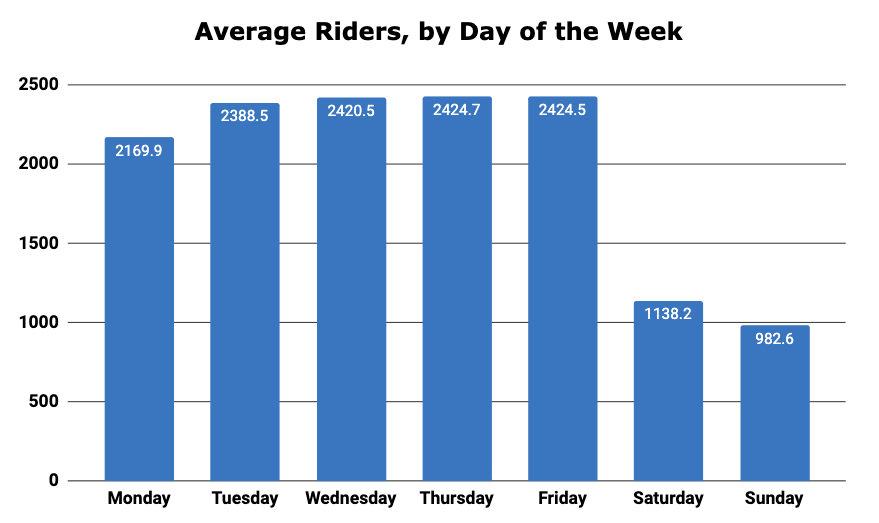
From this data we can see several relationships emerge between day of the week and average daily riders. First, we can see that ridership is clearly greater on the weekdays than on the weekends. Although not shown directly in the graph above, the daily average ridership on weekdays is 2.2x the daily average ridership on weekends (2365.7 vs 1060.7). Second, the average number of daily riders is very consistent on all days between Tuesday and Friday (1.5% variation at most). Third, that Mondays have a much lower average daily ridership than the other weekdays (between 10.5% and 9.2% lower). The third relationship stands out to me as particularly interesting, and unexpected, but I was unable to determine its cause. Despite being unable to determine a specific cause, several potential reasons occured to me. It could be that holidays and other days off for certain SMART commuters occur more frequently on Mondays than Fridays, or that certain SMART commuters are able to work from home on Mondays. It might be true that Fridays and Mondays are similar in terms of regular commuters, but an additional group of weekend travelers, or happy-hour attendees, chooses to use SMART on Fridays and therefore inflates the Friday ridership. Whatever the true cause of this difference in ridership, it’s interesting and would be worth a deeper look if more granular data or survey data were available.
Ridership by Season
By grouping SMART ridership by calendar month, we can see that the average riders per day is between 1788.1 (December) and 2275.5 (August). The data seems to suggest that the cooler/wetter months have a lower average daily ridership ridership than the warmer/drier months: 2105.2 for June-September compared to 1936.7 for December-March. After reviewing the other calendar months, I noticed that there may be a trend towards less ridership in the wet season and more ridership in the dry season.
Using U.S. Climate Data, I grouped the four wettest months together as the wet season (December - March) and the four driest months together as the dry season (June - September). The average daily ridership during the dry season was 2105.2 and during the wet season the average daily ridership was 1936.7. Although some of this seasonal difference can be attributed to a drop in ridership during the December/January holiday period, a larger portion of the difference stems from a decrease in both weekday and weekend ridership between the seasons. During the wet season, weekday average daily ridership is 2318.0 and weekend average daily ridership is 1008.0 . If we eliminate December 16th - January 7th data from the wet season data, weekday average daily ridership is 2379.0 and weekend average daily ridership is 1018.0. During the dry season, weekday average daily ridership is 2484.0 and weekend average daily ridership is 1202.0. After excluding the holiday period data, we observed a 4.2% drop in weekday average daily riders and 15.3% in weekend average daily riders from the dry season grouping to the wet season grouping.
Ridership by Adjusted Year
In order to make two year-over-year comparisons with the data, I had to align my definition of “year” with the data available to me in April 2020. At the time of this project, I only have access to full-month ridership data from September of 2017 to February of 2020. This means that if I want to compare three year data points, using the maximum length of comparable time possible, I must use Sept - Feb data as the “adjusted year.”
Adjusted Year 1 (Year 1): September 2017 to February 2018
Adjusted Year 2 (Year 2): September 2018 to February 2019
Adjusted Year 3 (Year 3): September 2019 to February 2020
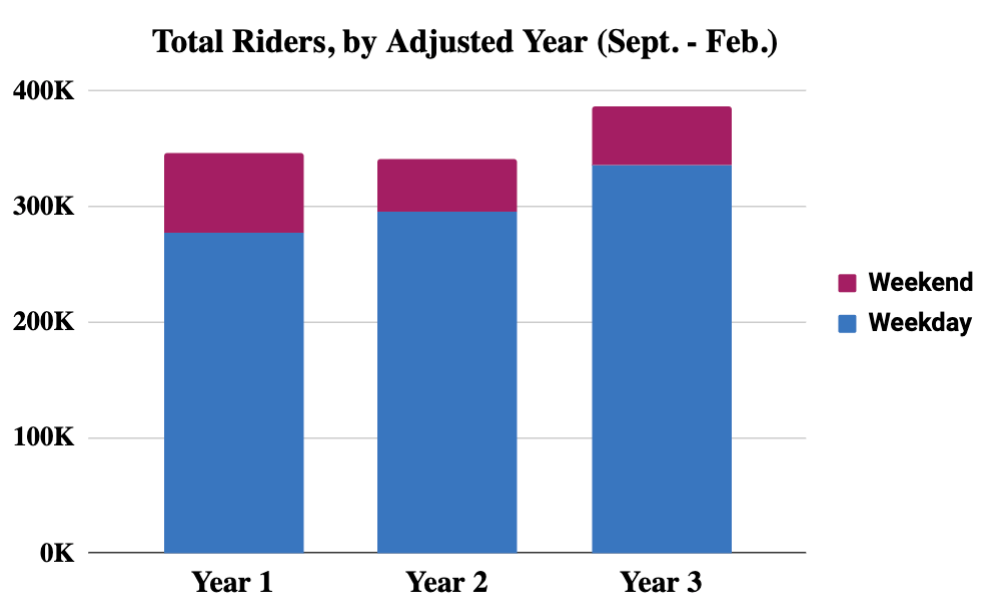
By comparing in this manner, we are able to notice three interesting trends in SMART ridership over the past 30 months:
First, total ridership has increased by 11.7% overall from year 1 to year 3, with a slight decrease in ridership of 1.7% in the second year and an increase of 13.7% in the third year.
Second, weekend ridership has decreased by 26.9% overall from year 1 to year 3, with a decrease of 35.4% in the second year and a subsequent increase of 13.1% in the third year.
Third, weekday ridership has increased by 21.4% overall from year 1 to year 3, with an increase of 6.7% in the second year and an increase of 13.7% in the third year.
Project Summary
The SMART public transit system is used more commonly on the weekdays than on the weekends, with a daily average ridership on weekdays of 2365.7 and an average daily ridership on weekends of 1060.7. On the weekdays, SMART also has a primary commute pattern of passengers heading South in the morning and North in the evening. This primary commute is evidenced by 2.2x the total number of Southbound AM riders than Northbound AM riders and 1.7x the average number of Northbound PM riders than Southbound PM riders. In addition to the daily trends described above, we are able to identify additional trends after shifting our focus to larger lengths of time, such as season and year.
If we group the Northbay’s four driest months together as the dry season (June - September ) and compare them to the four wettest months as the wet season (December - March), it is apparent that there are less riders on weekdays and weekends during the wet season. Even after compensating for the December & January holiday period, defined as December 16th - January 7th, there are 4.2% less riders on the weekdays and 15.3% less riders on the weekends.
When considering year to year analysis of SMART ridership data, I chose to adjust my definition of year to match the data that was available. By defining the 6-month period of September through February as the year, I was able to analyze three data points and control for seasonality. Under this definition, we can see that total ridership has increased overall from year 1 to year 3 by 11.7%, weekend ridership has decreased overall from year 1 to year 3 by 26.9%, and weekday ridership has gone up every year by 6.7% in year 2 and by 13.7% in year 3. The data seems to suggest that SMART is growing as it becomes more popular with commuters and other weekday riders, despite losing ridership on the weekends.
Methods
I downloaded two Excel datasets from SMART’s official website, sonomamarintrain.org, on April 9th, 2020, and converted them to Google Sheets files before performing my analysis. I cleaned the downloaded data, in order to better focus the analysis and display information in a manner that was easier to work with.
SMART Ridership Counts Through February 2020
On SMART Ridership Counts Through February 2020 !Raw Data, I moved all data points associated with the SMART train preview days, 6/29/17 - 7/16/17, out of the direct analysis table as these data points did not necessarily seem relevant. I then created two new columns to house DATEVALUE and Month # in order to visually check my work and to save myself a bit of time. It’s worth mentioning that these columns were not strictly necessary, but I did choose to add them.
I then proceeded to aggregate and average (mean) the ridership by train time, by train direction, by day of the week, by weekend/weekday, by month, by season, by “ year” (see Note #1), and by several combinations of the above descriptors. In order to evaluate aggregations and averages, I used combinations of Google Sheets formulas (COUNTIF, SUM, SUMPRODUCT, & DATEVALUE), inequality symbols and arithmetic.
Note #1: For “year” I decided to use the largest available comparable period of time (6 months, September through February), and compare these periods of time: Sept 2017 - Feb 2018, Sept 2018 - Feb 2019, & Sept 2019 - Feb 2020.
SMART February 2020 Ridership By Train
On the SMART February 2020 Ridership By Train spreadsheet, I created two additional sheets: Weekend Master and Weekday Master. I pulled over all daily information from each daily sheet and, based on the respective day of the week, copied the information onto the appropriate Master sheet. Once all of the information was on the Master sheets, I aggregated and averaged (mean) the riders by train in order to begin analysis. In order to check my work, I summed the riders on each day in the Master sheets and compared to the daily totals given by the SMART Ridership Counts Through February 2020 data set.