Background Information
The COVID-19 pandemic, and the public health containment measures that stem from it, has drastically changed our lives. Wearing masks in public and using hand sanitizer constantly have both become second nature. Although not as immediately apparent, I've also noticed that my daily screen time has increased considerably. Instead of meeting up with friends in my free time, I find myself streaming television shows and spending hours browsing the internet. When I do occasionally make plans to socialize with friends, we are forced to coordinate a time to get together on a video conferencing application. Between work and my social life, I’ve truly never felt this dependent on the internet and on electricity.
After noticing my own increased reliance on electricity, I started to wonder what patterns might be observable using the historical datasets available on PG&E's website. How does electricity usage change throughout the year? How does electricity usage vary by customer type? Has there been a measurable change in the proportion of electricity used by residential and commercial customers during COVID-19? Can we observe a similar result when focusing on only the North Bay counties of Sonoma, Marin & Napa?
Descriptive Markdown Document: pge_electricity_usage.md
Tip: If the above download link doesn't work for you, try to open the file in your browser instead by using this link.
About the Datasets
1. PG&E: Electric Usage By Zip
https://pge-energydatarequest.com/public_datasets
We will use all available “Electric Usage By Zip” datasets between Q1 2013 and Q2 2020. These data sets include TotalCustomers, TotalkWh, AveragekWh & CustomerClass variables for each zip code, by month and year. Notes: the Q3 2014 contains one year of data between October 2013 and September of 2014 and in order to avoid double counting, we will have to remove duplicate month data. The month of September 2017 also seems to be counted twice, in Q3 2017 and Q4 2017 and I chose to use the most current data as given in Q4 2017.
2. data.world: US Zipcode to County State to FIPS Look Up
https://data.world/niccolley/us-zipcode-to-county-state ("ZIP-COUNTY-FIPS_2018-03.csv")
This dataset will help us as we map zip codes given in the PG&E "Electric Usage By Zip" datasets to their respective counties, in order to study the electricity usage patterns at the county level. Notes: There are instances where zip codes are mapped to multiple counties and I chose to correct for this manually as explained in the markdown file.
About the Data Tables
In this project, we will query three SQL tables that we have created: 2013_2019_all_elec, 2020_q1_q2_elec & north_bay_data. The 2013_2019_all_elec table holds all available PG&E electrical energy usage data from 2013 to 2019 and 2020_q1_q2_elec holds that same type of data from Q1 and Q2 of 2020. The north_bay_data table holds all available PG&E electrical energy usage data from 2013 to Q2 2020, for zip codes associated with the North Bay counties of Sonona, Marin & Napa.
If you are interested in learning more about the creation of the tables used in this project, please view the descriptive markdown file, above.
Topic Outline
1. a. Historical Electricity Usage
b. Customer Class Specifics
2. COVID-19 Shelter-in-Place
b. North Bay Analysis
3. Project Summary
Historical Electricity Usage
After totaling the monthly electricity usage between 2013 and 2019, it is clear that electricity is not used uniformly throughout the year. More specifically, there appears to be two periods of high usage: June - September and December - January. In the first period of high usage,there is a consistent increase from April to July, followed by a brief plateau into August, and then a consistent decrease through November. In the second period of high usage, there is a much shorter and less pronounced increase in usage in December and January, followed by a decline in February.
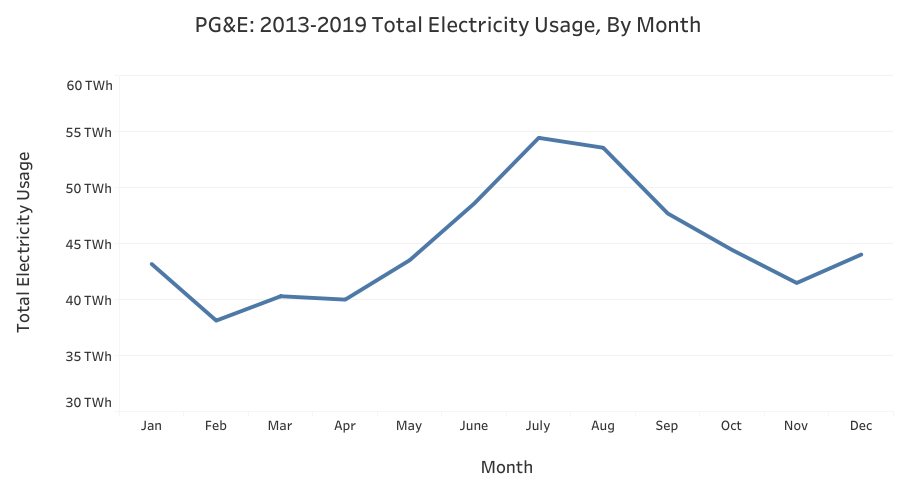
It is important to remember that this visualization includes data from all four customer classes -- commercial, residential, industrial & agricultural -- and we need to look more closely at each individual customer class to better understand the data.
Customer Class Specifics
PG&E reports electricity usage data on four distinct customer classes: commercial, residential, industrial & agricultural. We can think of commercial customers as businesses, residential customers as residences, industrial customers as factories and manufacturing plants, and agricultural customers as farms. Although this definition isn’t perfect or all-encompassing, it will suffice for this analysis.
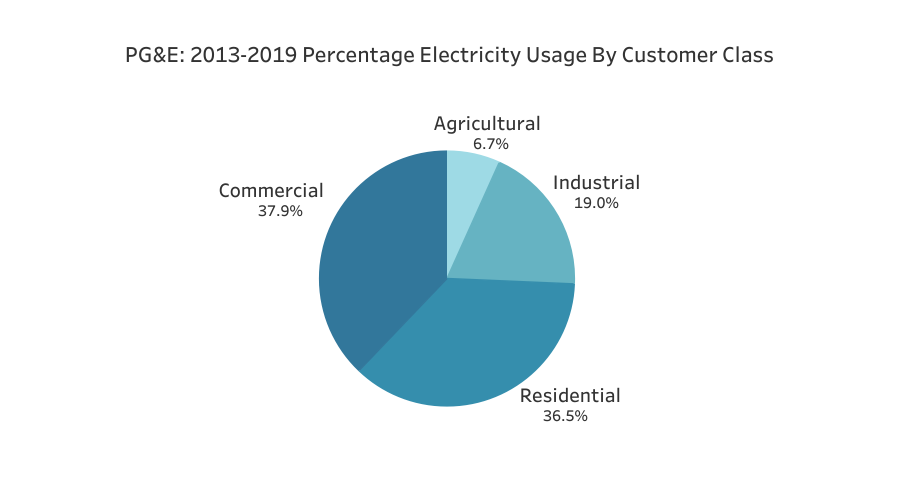
Between 2013 and 2019, commercial customers used the greatest percentage of total electricity with 37.9%. Residential customers were relatively close behind with 36.5% of the total electricity usage. Industrial and agricultural customers used significantly less electricity with 19.0% and 6.7%, respectively.
Commercial Customers (37.9% of total usage)
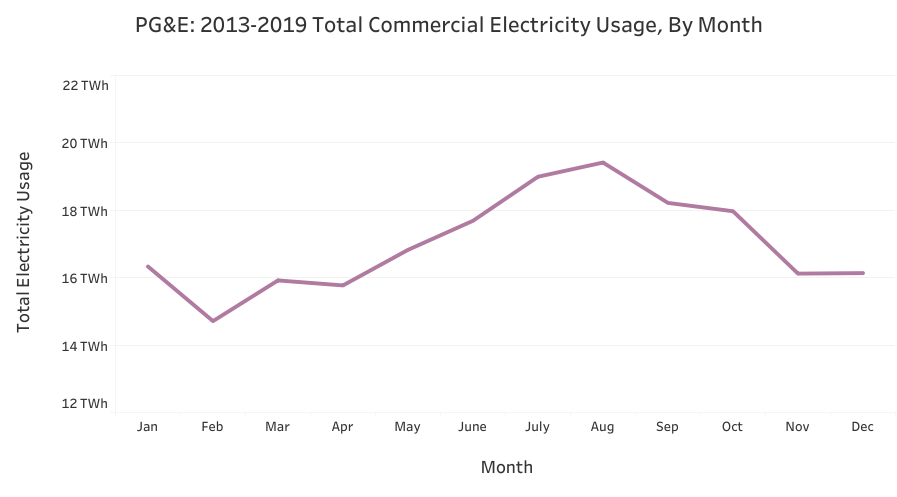
Description: Electricity usage for commercial customers is relatively consistent between January and April -- the majority of the 9.9% drop observed in February can be attributed to the low number of days in that month. Starting in April, electricity usage then increases consistently until August before decreasing consistently until November. Commercial customers used the most electricity between June and October, with August being the highest usage month. In November and December, electricity usage remains relatively stable and is similar in value to the usage total of January.
Interpretation: The single most prominent feature of this data is the summertime usage peak. One possible reason why commercial electricity usage is highest during this period is that businesses use much more electricity on air conditioners when it is warm. According to the U.S. Department of Energy, ‘Air conditioners use about 6% of all the electricity produced in the United States.’ If we assume that this is an annualized average, we can infer that this percentage may be much greater in the warmest periods of the year and much less in the coolest periods of the year; this difference could explain much of the summertime usage peak.
Although it is mentioned briefly above, the 9.9% drop in February can be mostly explained by the low number of days in February. During this 2013 - 2019 period, there is only one leap year. This means that our average number of days per February is 28.14 and this represents 9.2% less days than January and March. Note: I did not control for the number of days in each month during this analysis but the low number of days in February makes it an outlier worth mentioning.
Residential Customers (36.5% of total usage)
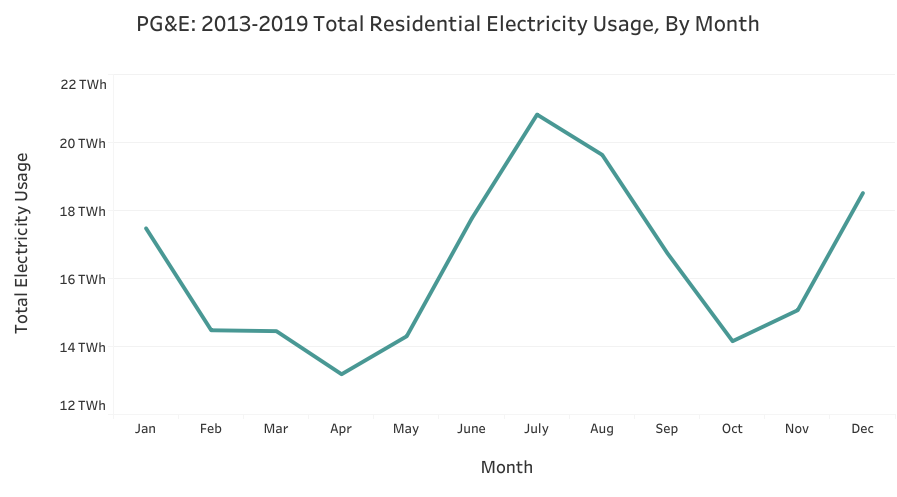
Description: Electricity usage for residential customers has two periods of significantly high usage, centered around December and July, and two periods of significantly low usage, centered around April and October. From January, a month of relatively high usage, until April, the month with the lowest usage, there is a relatively consistent decrease in electricity usage. Between April and July, electricity usage then increases consistently to the summer maximum, before decreasing consistently to October. In November and December, electricity usage increases consistently again to the winter maximum.
Interpretation: The residential electricity usage data has two very distinct periods of high usage, in summer and winter, and two very distinct periods of low usage, in spring and fall. In order to explain this, I contend that residential electricity usage is heavily influenced by both temperature and daylight.
As we did with commercial electricity usage, we can assume that a large portion of the summer high usage period is related to air conditioner use. The winter period of high usage, however, is uniquely apparent in the residential data and there could be several reasons for this. It may be that residential dwellings are relatively more likely to rely on electrical heating systems, as opposed to natural gas. It may also be that the seasonal fluctuations in lightbulb usage are far greater in residential customers than commercial customers. In the summer, when it is often light until 8 or 9 pm in California, I assume that residential customers turn on their lights for significantly less time than in the winter. Commercial customers, due to either building design or convention, may not be as likely to rely on natural light. Lastly, it also could be that residential customers are using more electricity to watch tv or spend time on the computer during the winter when outside activities may be limited.
In the spring and fall, when temperatures are much less extreme, residential customers might restrict their air conditioning and electric heater usage significantly. This, coupled with additional natural light when compared to winter, may explain why electricity usage is low in the spring and fall for residential customers.
Industrial Customers (19.0% of total usage)
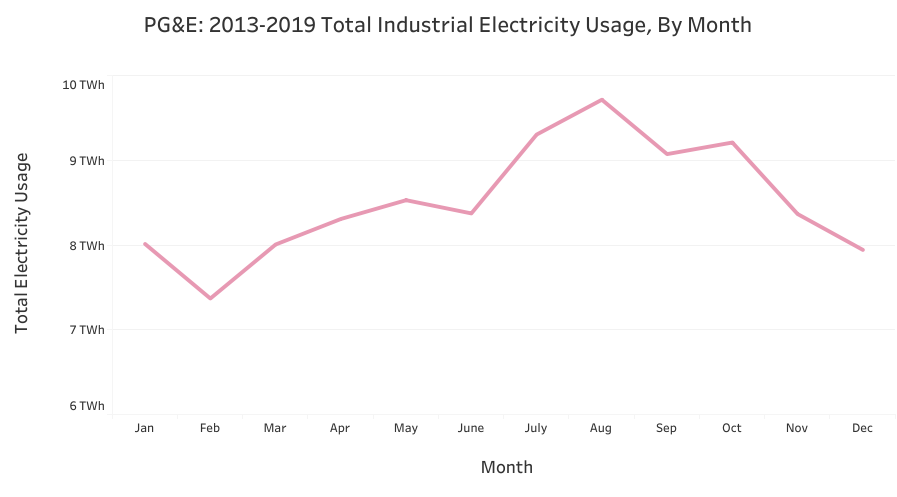
Description: Electricity usage for industrial customers follows a very similar trend as that of commercial customers; the months with the lowest electricity usage are in the winter, and the months with the highest electricity usage are mostly in the summer and early fall. Electricity usage for industrial customers is relatively consistent between January and March -- the majority of the 8.0% drop observed in February can be attributed to the low number of days in that month. Starting in March, electricity usage then increases somewhat consistently until August before decreasing somewhat consistently until December.
Interpretation: As in the commercial customer data, the most prominent feature of the industrial customer data is the summertime usage peak. If we apply the same logic as we did before, we can also assume that air conditioners are a major culprit of the increased industrial electricity usage in the summer. Nothing else really stands out to me about the industrial customer data and I think it's fair to interpret this data as we did the commercial customer data.
Agricultural Customers (6.7% of total usage)
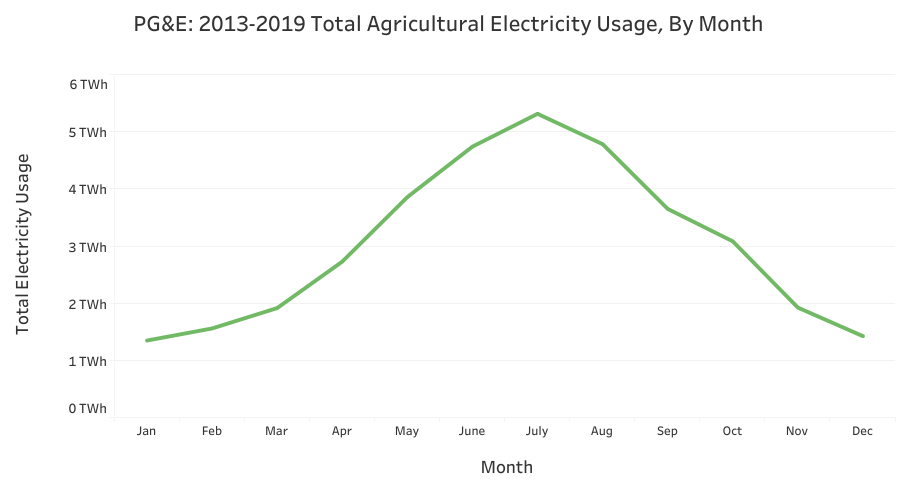
Description: Electricity usage for agricultural customers increases consistently and significantly between January and July, and then decreases consistently and significantly between July and December. When compared to the other customer classes, agricultural customer class exhibits the most pronounced period of relatively high usage with electricity usage in July being 390% of what it is in January.
Interpretation: According to the California Department of Food and Agriculture, irrigation pumping is responsible for the most agricultural electricity usage -- sources have estimated irrigation pumping to account for roughly 70% of electricity usage on farms. If we assume that this figure is accurate, and that irrigation is something needed most in the summer and least in the winter, then our data seems to fit well.
COVID-19 Shelter-in-Place
Now that we have reviewed the historical electricity usage aggregate data, we will shift our focus to the time period corresponding to the pandemic. I decided to focus on the months of April and May, after Gov. Gavin Newsom issued the shelter-in-place directive in Mid-March but before much of the state began to re-open. My hypothesis is that in this period during the pandemic, electricity usage has shifted from commercial customers and towards residential customers. If this is the case, we can expect to see an increase in our residential electricity:commercial electricity ratio (abbreviated as res_ele c/comm_elec), as compared to the same time period in prior years. Use the SQL query below to obtain the April-May res_elec/comm_elec ratio for the years 2013-2020.
WITH residential AS ( SELECT year, SUM(total_kwh) AS res_elec FROM 2013_2019_all_elec WHERE (customer_class = 'Elec- Residential' AND month IN (3,4)) GROUP BY year ), commercial AS ( SELECT year, SUM(total_kwh) AS comm_elec FROM 2013_2019_all_elec WHERE (customer_class = 'Elec- Commercial' AND month IN (3,4)) GROUP BY year ), residential20 AS ( SELECT year, SUM(total_kwh) AS res_elec20 FROM 2020_q1_q2_elec WHERE (customer_class = 'Elec- Residential' AND month IN (3,4)) GROUP BY year ), commercial20 AS ( SELECT year, SUM(total_kwh) AS comm_elec20 FROM 2020_q1_q2_elec WHERE (customer_class = 'Elec- Commercial' AND month IN (3,4)) GROUP BY year ) SELECT residential.year, res_elec/comm_elec FROM residential LEFT JOIN commercial ON commercial.year = residential.year UNION SELECT residential20.year, res_elec20/comm_elec20 FROM residential20 LEFT JOIN commercial20 ON commercial20.year = residential20.year ORDER BY 1;
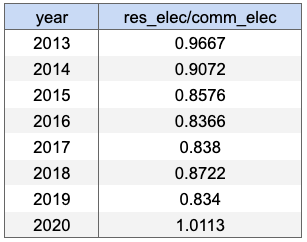
As the table above shows, we are able to find an increase in the res_elec/comm_elec data in 2020. The value for 2020 is equal to 1.0113 kwh of residential electricity per 1 kwh of commercial electricity and this value, in addition to being an increase from the 0.8340 value recorded in 2019, is a record high for the available PG&E data. Although our historical data set only covers 7 prior time periods, the high ratio value in 2020 may be evidence that there is a relationship between the pandemic and relative electricity usage between customer classes. In order to gain a clearer picture, however, let’s perform a slightly different query to better understand how each of the two res_elec/comm_elec ratio components changed.
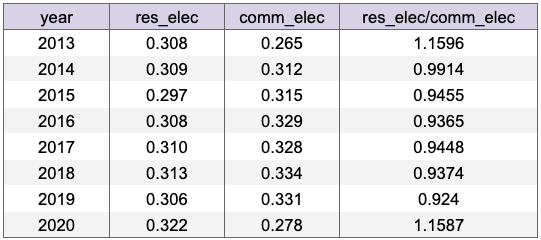
SELECT year, ROUND(res_elec/1000000000,2) AS res_elec, ROUND(comm_elec/1000000000,2) AS comm_elec, res_elec/comm_elec FROM (SELECT year, SUM(CASE WHEN customer_class = 'Elec- Residential' THEN total_kwh ELSE 0 END) AS res_elec, SUM(CASE WHEN customer_class = 'Elec- Commercial' THEN total_kwh ELSE 0 END) AS comm_elec FROM 2013_2019_all_elec WHERE month IN (3,4) GROUP BY year) AS historical_data UNION SELECT year, ROUND(res_elec20/1000000000,2) AS res_elec20, ROUND(comm_elec20/1000000000,2) AS comm_elec20, res_elec20/comm_elec20 FROM (SELECT year, SUM(CASE WHEN customer_class = 'Elec- Residential' THEN total_kwh ELSE 0 END) AS res_elec20, SUM(CASE WHEN customer_class = 'Elec- Commercial' THEN total_kwh ELSE 0 END) AS comm_elec20 FROM 2020_q1_q2_elec WHERE month IN (3,4) GROUP BY year) AS 2020_data ORDER BY year ASC;
Note: For readability, the res_elec and comm_elec values are being given in Terawatt Hours (TWh), rounded to the second decimal place.
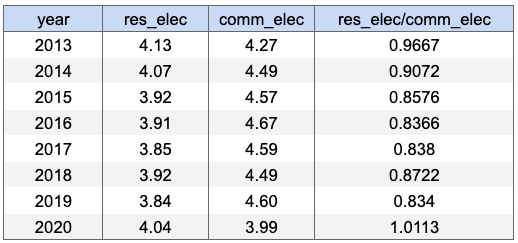
When we look more closely into the historic low of res_elec/comm_elec in April-May of 2020, we can see that it was primarily due to a low commercial electricity usage value. Although the elec_res value was slightly higher than average in 2020, 4.04 TWh compared to 3.96 TWh, the elec_comm value 2020 was historically low: 3.99 TWh. This result does not seem to support the idea that electricity usage has shifted from commercial customers to residential customers during the pandemic, but rather that electricity usage was simply much lower in commercial customers than usual.
To account for changes in total customers in each class, let’s also analyze average monthly KWh per customer, specifically for April and May, from 2013 to 2020 and compare to our results above.
SELECT year, ROUND(AVG(avg_monthly_res_kwh),2) AS avg_apr_may_monthly_res_kwh, ROUND(AVG(avg_monthly_comm_kwh),2) AS avg_apr_may_monthly_comm_kwh FROM (SELECT year, month, total_res_kwh, total_res_customers, total_res_kwh/total_res_customers AS avg_monthly_res_kwh, total_comm_kwh, total_comm_customers, total_comm_kwh/total_comm_customers AS avg_monthly_comm_kwh FROM (SELECT year, month, SUM(CASE WHEN customer_class = 'Elec- Residential' THEN total_kwh ELSE 0 END) AS total_res_kwh, SUM(CASE WHEN customer_class = 'Elec- Residential' THEN total_customers ELSE 0 END) AS total_res_customers, SUM(CASE WHEN customer_class = 'Elec- Commercial' THEN total_kwh ELSE 0 END) AS total_comm_kwh, SUM(CASE WHEN customer_class = 'Elec- Commercial' THEN total_customers ELSE 0 END) AS total_comm_customers FROM 2013_2019_all_elec WHERE month IN (3,4) GROUP BY 1,2) AS monthly_totals ) AS period_totals GROUP BY year UNION SELECT year, ROUND(AVG(avg_monthly_res_kwh20),2) AS avg_apr_may_monthly_res_kwh20, ROUND(AVG(avg_monthly_comm_kwh20),2) AS avg_apr_may_monthly_comm_kwh20 FROM (SELECT year, month, total_res_kwh20, total_res_customers20, total_res_kwh20/total_res_customers20 AS avg_monthly_res_kwh20, total_comm_kwh20, total_comm_customers20, total_comm_kwh20/total_comm_customers20 AS avg_monthly_comm_kwh20 FROM (SELECT year, month, SUM(CASE WHEN customer_class = 'Elec- Residential' THEN total_kwh ELSE 0 END) AS total_res_kwh20, SUM(CASE WHEN customer_class = 'Elec- Residential' THEN total_customers ELSE 0 END) AS total_res_customers20, SUM(CASE WHEN customer_class = 'Elec- Commercial' THEN total_kwh ELSE 0 END) AS total_comm_kwh20, SUM(CASE WHEN customer_class = 'Elec- Commercial' THEN total_customers ELSE 0 END) AS total_comm_customers20 FROM 2020_q1_q2_elec WHERE month IN (3,4) GROUP BY 1,2) AS monthly_totals20 ) AS period_totals20 GROUP BY year ORDER BY year;
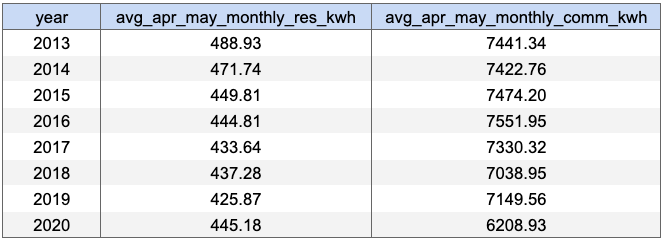
From our average monthly results above, we can see that although average residential kWh did increase slightly in April-May 2020, average commercial kWh decreased considerably and was at an all time low. This result reinforces what we observed in total TWh and helps to account for changes in total TWh data that were due to total customer fluctuations within each customer class.
North Bay Analysis
To see if we can observe a similar result in the North Bay counties of Sonoma, Marin & Napa, we can perform similar queries as above using our north_bay_data table. We will still report our total values for res_elec and comm_elec in Terawatt Hours (TWh), but will instead round to 3 decimal places.
SELECT year, ROUND(res_elec/1000000000,2) AS res_elec, ROUND(comm_elec/1000000000,2) AS comm_elec, res_elec/comm_elec FROM (SELECT year, SUM(CASE WHEN customer_class = 'Elec- Residential' THEN total_kwh ELSE 0 END) AS res_elec, SUM(CASE WHEN customer_class = 'Elec- Commercial' THEN total_kwh ELSE 0 END) AS comm_elec FROM north_bay_data WHERE month IN (3,4) GROUP BY year) AS historical_data ORDER BY year ASC;
After limiting our analysis to only the North Bay, we can see that the res_elec/comm_elec ratio was higher than average in April-May of 2020, but it was not not historically high. The residential electricity usage, however, was higher in April-May 2020 than it had been in April-May 2013-2019 and this may provide some evidence that residential customers are bearing a bit heavier burden than usual. It is important to keep in mind that we have not attempted to control for outside variables during this analysis, such as weather, that may influence our data.
Again, let’s also analyze the average monthly KWh per North Bay customer, specifically for April and May, from 2013 to 2020 and compare to our results above.
SELECT year, ROUND(AVG(avg_monthly_res_kwh),2) AS avg_apr_may_monthly_res_kwh, ROUND(AVG(avg_monthly_comm_kwh),2) AS avg_apr_may_monthly_comm_kwh FROM (SELECT year, month, total_res_kwh, total_res_customers, total_res_kwh/total_res_customers AS avg_monthly_res_kwh, total_comm_kwh, total_comm_customers, total_comm_kwh/total_comm_customers AS avg_monthly_comm_kwh FROM (SELECT year, month, SUM(CASE WHEN customer_class = 'Elec- Residential' THEN total_kwh ELSE 0 END) AS total_res_kwh, SUM(CASE WHEN customer_class = 'Elec- Residential' THEN customer_count ELSE 0 END) AS total_res_customers, SUM(CASE WHEN customer_class = 'Elec- Commercial' THEN total_kwh ELSE 0 END) AS total_comm_kwh, SUM(CASE WHEN customer_class = 'Elec- Commercial' THEN customer_count ELSE 0 END) AS total_comm_customers FROM north_bay_data WHERE month IN (3,4) GROUP BY 1,2) AS monthly_totals ) AS period_totals GROUP BY year ORDER BY year ASC;
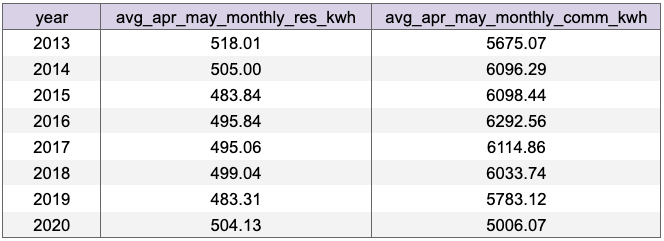
As we can see in the above table, the North Bay average monthly kWh data for April-May appears to be in line with the state-wide data. Although average residential kWh increased slightly in April-May 2020, average commercial kWh decreased significantly and was at an all time low. This data does not seem to support our original idea that the burden of electricity has shifted from commercial customers to residential customers, but rather that commercial customers are simply using less electricity.
Project Summary
Using PG&E’s publicly available electricity usage data from 2013 to 2019, we were able to visualize trends in overall electricity usage and electricity usage by customer class over the entirety of the 7 complete years of historical data. We found that commercial customers used the greatest proportion of electricity at 37.9%, followed by residential customers at 36.5%, industrial customers at 19.0% and agricultural customers at 6.7%. During a typical year, overall electricity usage is greatest in July and August when the temperature is high and commercial, residential & industrial customers are using their air conditioners the most. Also, in the summer, agricultural customers recorded an electricity usage peak that we attributed to their elevated use of irrigation equipment.
When we shifted our focus to the effect that the COVID-19 pandemic had on electricity usage during April and May, we were unable to find evidence that residential customers used considerably more electricity in 2020 than they have in past years. However, we were able to find evidence that commercial customers used significantly less total electricity and average electricity per customer -- approximately 6.6% less and 11.9% less than the previous lows, respectively -- in April and May of 2020 as compared to those same months in 2013-2019. When limiting our analysis to the North Bay counties of Sonoma, Marin and Napa, we were able to observe very similar results in total electricity and average electricity per customer, for the commercial and residential customer classes. Although these findings do not support our hypothesis that the COVID-19 pandemic has shifted electricity usage from commercial to residential customers, these results are still interesting.
The most simple explanation for the data is that the pandemic and shelter-in-place directive did not have any measurable effect on residential electricity usage. However, it also could be the case that variables we did not control for have acted to suppress the observable effect. Temperature is one such variable that we would want to attempt to control for if we were to re-do this project in the future. If the weather in April and May of 2020 was such that it led to significantly lower air conditioner use than on an average year, that may have helped hide the increase in residential electricity usage related to the pandemic. We also would want to see if it were possible to control for the net number of people who left California during the pandemic. If the number of people who left California was large enough, it may have had an effect on total and average residential electricity usage data. These people may have kept their apartments or houses in California and I assume they would be counted as customers, despite using very little to no electricity. Controlling for this, along with year to year weather fluctuations, might allow us to better understand the data. In this project, however, our data did not support to the idea that the burden of electricity usage shifted from commercial customers towards residential customers during COVID-19 pandemic and shelter-in-place directive.