Background Information
As a longtime fan of National Football League (NFL) football, I’ve committed many beliefs to memory without verifying them to be true: home teams win more often than away teams, west coast teams have a comparative disadvantage when traveling to the east coast, scoring has increased over time, games are closer now than they were in the past, teams are now relying more heavily on the passing game than on the running game, and temperature has a significant impact on the game. I decided that it might be prudent to test these theories, using SQL, R, and two NFL datasets (“box_scores.csv” and “nfl_game_weather.csv” from Kaggle). The findings of this data analysis project are below, as well as a descriptive markdown document for anyone who wishes to replicate the project.
Descriptive Markdown Document: nfl_fan_beliefs.md
Tip: If the above download link doesn't work for you, try to open the file in your browser instead by using this link.
About the Datasets
The first dataset, box_scores, holds detailed box score information for 4328 individual NFL games that occurred between September 9, 2001 and October 5, 2017. Example columns: home_first_downs, visitor_net_yards_rushing, home_field_goals, and visitor_passing_splits.
The second dataset, game_weather, holds basic game score and weather information for 11192 individual NFL games that occurred between September 23, 1960 and December 29, 2013. Example columns: home_score, away_score, temperature, and wind_mph.
It is important to note that although there is a period of overlap between the two datasets, September 9, 2001 - December 29, 2013, the two datasets do not match up perfectly and game_weather misses data from approximately 200 games during this period of overlap where approximately 3400 games were played.
About the Data Tables
In the queries and analyses below, I reference four individual tables: box_scores, game_weather, union_nfl_data and temperature_score_data. The box_scores and game_weather tables are very similar to their source datasets, although I did add several additional columns and modify existing ones in order to facilitate analysis.
The union_nfl_data table was formed through a union of the box_scores and game_weather tables -- using several columns that were found in both tables, while ensuring not to double count any games during the overlapping time period.
The temperature_score_data table was formed using only the games that were found in both the box_scores and game_weather tables, containing only columns relevant to the analysis below.
If you are curious as to exactly how I formed these tables, or have other questions about my start-to-finish process, check out the descriptive markdown document above.
Topic Outline
1. Simple Home Field Advantage
2. Relative Home Field Advantage: East Coast Hosting West Coast
3. Total Scoring Over Time
4. Game Competitiveness Over Time
5. Increased Emphasis on Passing Over Time
6. Low Temperature and the NFL
7. Project Summary
Simple Home Field Advantage
The idea of home field advantage in the NFL is something that is referenced frequently -- almost to the point where no fan doubts that it exists. Like most fans, I too believe that home field advantage exists, but have only a limited understanding of the strength of that advantage. In the query below, I decided to use the union_nfl_data table, as it spans 58 NFL seasons and represents the largest set of relevant data for this topic.
Home Field Advantage: union_nfl_data
SELECT COUNT(home_score) AS total_games ,SUM(CASE WHEN home_score > away_score THEN '1' WHEN home_score < away_score THEN '0' ELSE NULL END) as home_wins ,SUM(CASE WHEN home_score < away_score THEN '1' WHEN home_score > away_score THEN '0' ELSE NULL END) AS away_wins ,SUM(CASE WHEN home_score = away_score THEN '1' ELSE NULL END) AS ties ,ROUND(100*(SUM(CASE WHEN home_score > away_score THEN '1' WHEN home_score <= away_score THEN '0' ELSE NULL END))/(COUNT(home_score)),2) AS home_win_percent, ROUND(100*(SUM(CASE WHEN home_score < away_score THEN '1' WHEN home_score >= away_score THEN '0' ELSE NULL END))/(COUNT(home_score)),2) AS away_win_percent, ROUND(100*(SUM(CASE WHEN home_score = away_score THEN '1' ELSE NULL END))/(COUNT(home_score)),2) AS ties_percent FROM union_nfl_data;

Using the union_nfl_data table, we observe that the home team wins 57.11% of the time, the away team wins 42.08% of the time and ties account for less than 1% of the 12,284 games recorded. Without considering any other inputs, the home team has a significant inherent advantage and is 1.36 times more likely to win an average game than the away team is. Quick note: all of the datasets include both regular season and postseason games -- overtime rules and the setting of games can be different in these settings, but the fraction of postseason games is low enough that I won't worry about it for this analysis.
Relative Home Field Advantage: East Coast Hosting West Coast
Several times, both on ESPN and in casual conversation with friends, I have heard people say that West Coast teams have an added disadvantage when traveling to the East Coast -- losing three hours due to the time difference is often cited as the cause. As someone who travels from the West Coast to the East Coast about once a year, I can attest that the time difference in that direction can be difficult to get used to. For this topic, I will be querying union_nfl_data table as it has the greatest amount of relevant datapoints.
SELECT SUM(CASE WHEN home_score > away_score THEN '1' WHEN home_score < away_score THEN '0' ELSE NULL END) AS east_coast_home_wins ,SUM(CASE WHEN home_score < away_score THEN '1' WHEN home_score > away_score THEN '0' ELSE NULL END) AS west_coast_away_wins ,SUM(CASE WHEN away_score <> home_score THEN '1' WHEN away_score = home_score THEN '0' ELSE NULL END) AS total_non_ties ,(SUM(CASE WHEN home_score > away_score THEN '1' WHEN home_score < away_score THEN '0' ELSE NULL END))/(SUM(CASE WHEN away_score <> home_score THEN '1' WHEN away_score = home_score THEN '0' ELSE NULL END)) AS east_coast_home_win_ratio FROM union_nfl_data WHERE home_team_time_zone = 'Eastern' AND away_team_time_zone = 'Pacific';

It is very interesting that east coast home teams hosting west coast teams were actually less likely to win than the average home team (53.95% vs 57.11%). The result of this simple query does not seem to support the belief that east coast teams have a relatively stronger home field advantage when hosting west coast teams. This topic requires further analysis as a relatively strong West Coast cohort may be skewing the results; team strength in various years is an important variable to control for.
I decided to use overall winning percentage in the season to represent a team's strength, and then use the difference in team strengths to categorize the matchup. In the queries below, I’ve used the difference between the season win percentage of the home team and the away team (labeled as net_win_perc) to create buckets in order to compare home team win proportions. I will use the 25th, 50th, and 75th percentiles of net_win_perc -- evaluated using quantile() in R -- as the cut-offs for the buckets and compare my sample group (east coast home games when playing a west coast opponent) to the control group (all non east-west games). If there is a relative advantage for east coast home teams when hosting west coast teams, I expect to see relatively large home team win proportions in each bucket.
WITH cteTeamStrength AS (SELECT home_team, away_team, season, home_non_tie_games, home_wins, home_win_perc, away_non_tie_games, away_wins, away_win_perc, (home_wins + away_wins)/(home_non_tie_games + away_non_tie_games) AS overall_win_perc FROM ( SELECT home_team ,season ,SUM(CASE WHEN home_score <> away_score THEN '1' ELSE '0' END) AS home_non_tie_games ,SUM(CASE WHEN home_score > away_score THEN '1' ELSE '0' END) AS home_wins ,SUM(CASE WHEN home_score > away_score THEN '1' ELSE '0' END)/SUM(CASE WHEN home_score <> away_score THEN '1' ELSE '0' END) AS home_win_perc FROM union_nfl_data GROUP BY home_team, season) AS tshome JOIN ( SELECT away_team, season2, away_non_tie_games, away_wins, away_win_perc FROM ( SELECT away_team ,season AS season2 ,SUM(CASE WHEN home_score <> away_score THEN '1' ELSE '0' END) AS away_non_tie_games ,SUM(CASE WHEN home_score < away_score THEN '1' ELSE '0' END) AS away_wins ,SUM(CASE WHEN home_score < away_score THEN '1' ELSE '0' END)/SUM(CASE WHEN home_score <> away_score THEN '1' ELSE '0' END) AS away_win_perc FROM union_nfl_data GROUP BY away_team, season2) AS tsaway ) AS tsaway ON tshome.home_team = tsaway.away_team AND tshome.season = tsaway.season2 ), cteBoxScoreAnnotated AS ( SELECT u.home_team ,u.away_team ,u.home_score ,u.away_score ,ts1.overall_win_perc AS home_win_perc ,ts2.overall_win_perc AS away_win_perc ,ts1.overall_win_perc - ts2.overall_win_perc AS net_win_perc ,CASE WHEN home_team_time_zone = 'Eastern' AND away_team_time_zone = 'Pacific' THEN '1' ELSE '0' END AS west_at_east_game ,CASE WHEN home_team_time_zone = 'Pacific' AND away_team_time_zone = 'Eastern' THEN '1' ELSE '0' END AS east_at_west_game ,CASE WHEN home_score > away_score THEN '1' ELSE '0' END AS home_team_won ,CASE WHEN home_score < away_score THEN '1' ELSE '0' END AS away_team_won FROM union_nfl_data u JOIN cteTeamStrength ts1 ON u.home_team = ts1.home_team AND u.season = ts1.season JOIN cteTeamStrength ts2 ON u.away_team = ts2.away_team AND u.season = ts2.season ) SELECT CASE WHEN net_win_perc >= .1875 THEN 'Heavy Home Favorite' WHEN net_win_perc > 0 THEN 'Slight Home Favorite' WHEN net_win_perc >= -.1875 THEN 'Slight Away Favorite' WHEN net_win_perc < -.1875 THEN 'Heavy Away Favorite' END AS relative_team_strength ,AVG(CASE WHEN NOT (east_at_west_game OR west_at_east_game) THEN home_team_won END) AS prop_home_win ,AVG(CASE WHEN west_at_east_game THEN home_team_won END) AS prop_home_win_west_at_east FROM cteBoxScoreAnnotated GROUP BY relative_team_strength ORDER BY 2 DESC;
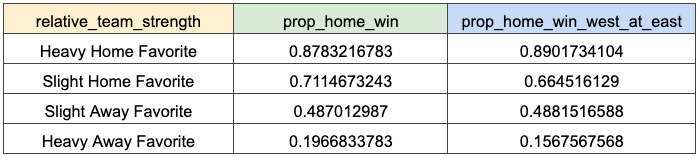
After attempting to control for team strength, the results do not seem to support the belief that east coast teams have a relative advantage when hosting west coast teams as prop_home_win_west_at_east is not consistently greater than prop_home_win for each bucket. If I were to perform additional analysis on this topic, I would attempt to control more perfectly for team strength and, if the data was available to me, isolate morning games to study these specifically.
Total Scoring Over Time
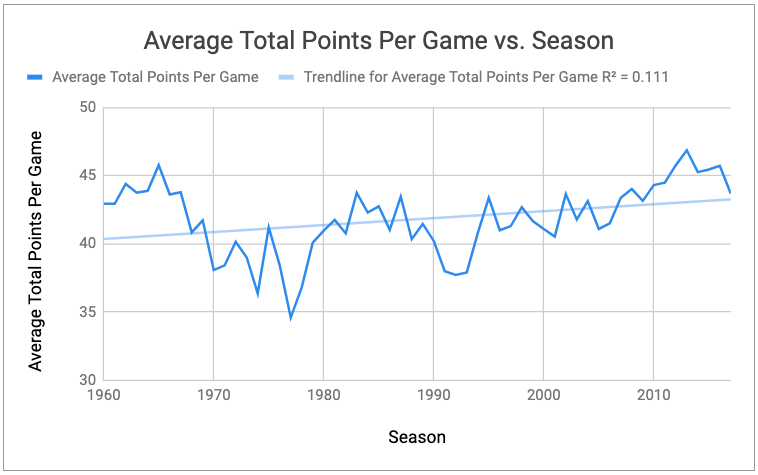
In order to understand how total game scoring has changed over time, and to see if the average game has been higher scoring in recent years, I decided to query the union_nfl_data table for average total points per game, by season and decade.
Total Scoring By Season
SELECT season ,AVG(home_score + away_score) AS average_total_points_per_game FROM union_nfl_data GROUP BY season ORDER BY season ASC;
Total Scoring By Decade
SELECT CONCAT(CASE WHEN season < 2000 THEN '19' ELSE '20' END,SUBSTRING(season,3,1),'0s') AS decade ,AVG(home_score + away_score) AS average_total_points_per_game FROM union_nfl_data GROUP BY 1 ORDER BY 1 ASC;
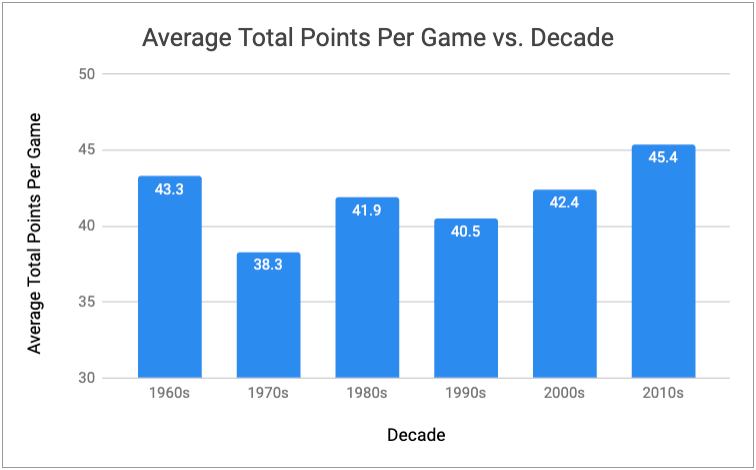
Whether or not there has been an increase in scoring over time in the NFL largely depends on the time-frame of our study. After dropping from 43.3 points/game in the 1960s to 38.3 points/game in the 1970s, average total game points has increased in three of the four subsequent decades and it eventually reached 45.4 points/game in the 2010s. If we model the linear relationship between average game totals and season, we see that the relationship is fairly weak (R-squared of 0.111) over the entire date range. However, using that same model with more recent date ranges, we notice a much stronger correlation between average total points and season: R-squared of 0.717 from 1990 to 2017, and R-squared of 0.637 from 2000 to 2017. I point this out because that the small R-squared of 0.111 accross the entire date range doesn’t perfectly represent the two major scoring trends that can be observed within the data.
At a later date, it would be interesting to map the year-to-year variance in several scoring measurements to the major rules changes and popular trends in playing styles throughout NFL history.
Game Competitiveness Over Time
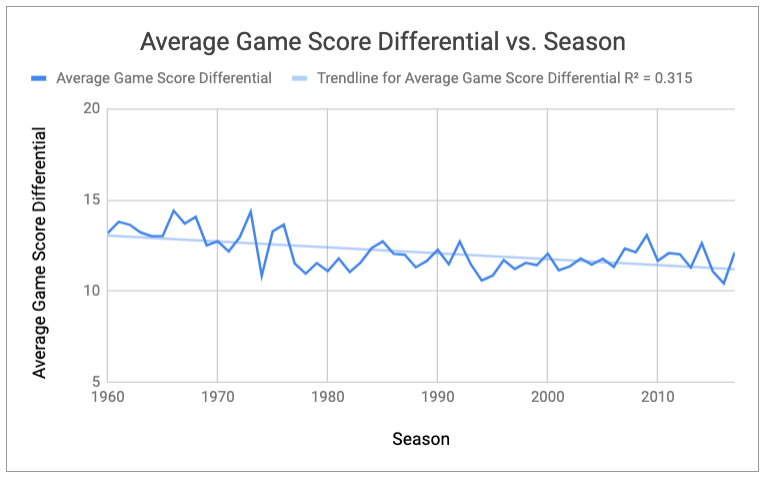
In order to measure competitiveness over time, I decided to use the union_nfl_data table and look at the average game score differential across seasons and decades. If, in fact, the average game is becoming more competitive, or closer, I expect the score differential to go down over time.
Game Competitiveness By Season
SELECT season ,AVG(ABS(home_score - away_score)) AS average_game_score_differential FROM union_nfl_data GROUP BY season ORDER BY season ASC;
Game Competitiveness By Decade
SELECT CONCAT(CASE WHEN season < 2000 THEN '19' ELSE '20' END,SUBSTRING(season,3,1),'0s') AS decade ,AVG(ABS(home_score - away_score)) AS average_game_score_differential FROM union_nfl_data GROUP BY 1 ORDER BY 1 ASC;
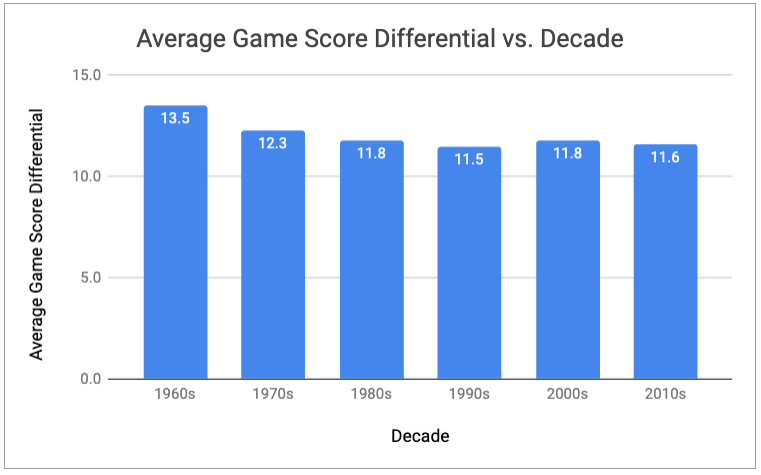
Although the data does show a consistent decrease in average game score differential from the 1960s to the 1980s, the trend does not continue in the subsequent decades. In other words, if you are comparing the NFL of the 2010s to the NFL of the 1960s or 1970s, there is a noticeable decrease in the average game score differential and it would be reasonable to conclude that a typical game may now be closer in score. However, when comparing the 2010s to the 1980s, 1990s, or 2000s, average game score differential remains relatively stable and does not support the belief that NFL games are becoming more competitive each year. In a future project, with access to more granular game score data, it would be interesting to create other proxies for competitiveness and study them by season and decade.
Increased Emphasis on Passing Over Time
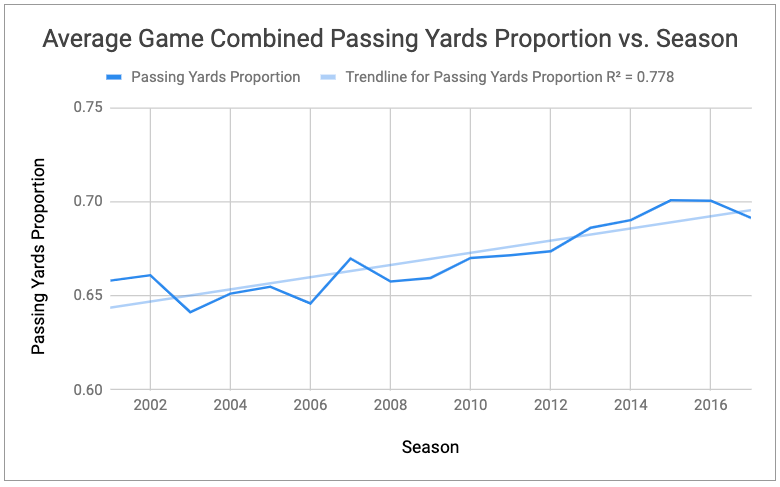
In order to better understand whether or not there is a greater emphasis on the pass game in recent years, I will look at two averaged game-level variables, total combined passing yards proportion and total combined passing plays proportion, by season. The passing yards proportion represents the proportion of combined passing yards from combined passing and rushing yards, and the passing plays proportion represents the proportion of combined passing plays from combined passing and rushing plays. Quick note: I chose to use net_passing_yards in the passing yards proportion because I did not want negative sack yards to skew the proportion.
Passing Yards Proportion
SELECT season ,AVG((visitor_gross_passing + home_gross_passing) / (visitor_net_yards_rushing + home_net_yards_rushing + visitor_gross_passing+home_gross_passing)) AS passyards_proportion FROM box_scores GROUP BY season ORDER BY season;
Passing Plays Proportion
SELECT season
,AVG(((home_gross_passing/home_yards_per_pass) + (visitor_gross_passing/visitor_yards_per_pass))/(home_rushing_plays + visitor_rushing_plays)) AS total_combined_passplays_to_runplay
FROM box_scores GROUP BY season ORDER BY season ASC;
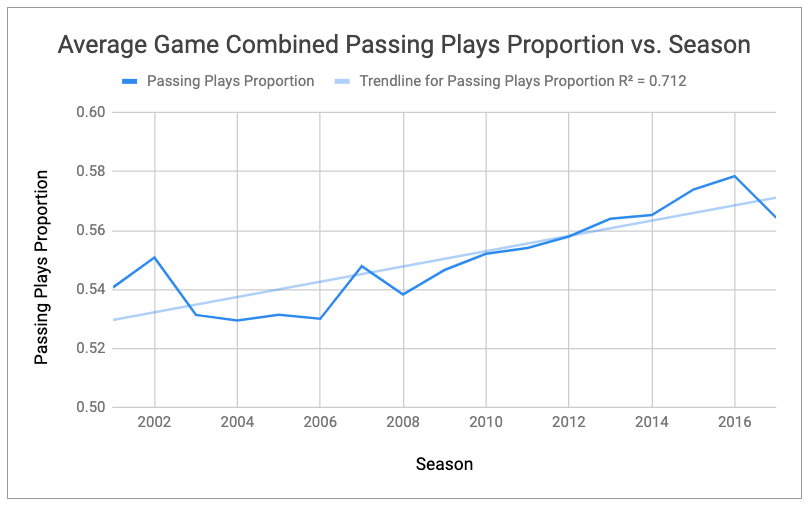
The available data from 2001 to 2017 seems to suggest that there is a greater recent emphasis on passing as both the passing yards proportion and passing plays proportion have increased relatively consistently from 2001 to 2017. If we model the linear relationship of each of the variables independently with season, we observe a strong R-squared value for each: 0.778 for passing passing yards proportion and 0.712 for passing passing yards proportion.
Low Temperature and the NFL
Speaking from my own experience, cold weather seems to have a noticeable impact on the ability to quickly and correctly perform tasks when outdoors. Do professional athletes also feel the impact of cold weather, and is that impact observable in the game_weather and box_scores datasets? In order to better understand this issue, I will study the effect of low temperatures on rushing yards proportion, rushing plays proportion, and total game points. I defined low temperature games to be in the 5th percentile of temperature, or colder than 29 degrees Fahrenheit, and games with average weather to be between the 25th and 75th percentile, or warmer than 46 degrees Fahrenheit but cooler than 72 degrees Fahrenheit. Quick note: I decided to eliminate any 0 degree games from this study, as it seems that some of the recorded 0s may have been incorrectly recorded. In the analyses below, I am querying the temperature_score_data table -- the table formed by the overlapping games in the game_weather and box_scores datasets.
Low Temperature and Rushing Proportions
According to what I’ve heard, anecdotally, about football, teams are more likely to run in cold weather than they are in average weather. This is because passing and catching the football in extremely low temperatures becomes relatively more difficult. If this is true, we can expect the proportions of rushing plays and rushing yards -- relative to total rushing and passing plays and total rushing and passing yards, respectively -- to increase in extremely low temperatures as compared to average temperatures.
Rushing Yards Proportion
WITH win_low AS ( SELECT AVG(winner_net_yards_rushing/(winner_gross_passing+winner_net_yards_rushing)) AS win_rushyards_prop_low FROM temperature_score_data WHERE temperature <> 0 AND temperature < 29 ), win_avg AS ( SELECT AVG(winner_net_yards_rushing/(winner_gross_passing+winner_net_yards_rushing)) AS win_rushyards_prop_avg FROM temperature_score_data WHERE temperature < 72 AND temperature > 46 ), los_low AS ( SELECT AVG(loser_net_yards_rushing/(loser_gross_passing+loser_net_yards_rushing)) AS los_rushyards_prop_low FROM temperature_score_data WHERE temperature <> 0 AND temperature < 29 ), los_avg AS ( SELECT AVG(loser_net_yards_rushing/(loser_gross_passing+loser_net_yards_rushing)) AS los_rushyards_prop_avg FROM temperature_score_data WHERE temperature < 72 AND temperature > 46 ) SELECT wa.win_rushyards_prop_avg ,wl.win_rushyards_prop_low ,la.los_rushyards_prop_avg ,ll.los_rushyards_prop_low FROM win_low wl JOIN win_avg wa JOIN los_low ll JOIN los_avg la;
Winners Losers
The rushing yards proportion data seems to support the belief that teams rely more heavily on the run in extremely low temperature games as compared to average temperature games. Using the temperature_score_data table, we are able to observe increases in rushing yards proportions from 0.375 to 0.393 for winning teams and from 0.299 to 0.337 for losing teams. It’s worth noting that each of the average rushing yards proportions are less than 0.5. This implies that, despite the relative changes that occurred in extremely low temperature games, passing yardages are typically going to represent the majority of offensive yardage totals for any of the groups studied above.
Rushing Plays Proportion
WITH win_low AS ( SELECT AVG(winner_rushing_plays/(winner_rushing_plays+winner_est_passing_plays)) AS win_rushplays_prop_low FROM temperature_score_data WHERE temperature <> 0 AND temperature < 29 ), win_avg AS ( SELECT AVG(winner_rushing_plays/(winner_rushing_plays+winner_est_passing_plays)) AS win_rushplays_prop_avg FROM temperature_score_data WHERE temperature < 72 AND temperature > 46 ), los_low AS ( SELECT AVG(loser_rushing_plays/(loser_rushing_plays+loser_est_passing_plays)) AS los_rushplays_prop_low FROM temperature_score_data WHERE temperature <> 0 AND temperature < 29 ), los_avg AS ( SELECT AVG(loser_rushing_plays/(loser_rushing_plays+loser_est_passing_plays)) AS los_rushplays_prop_avg FROM temperature_score_data WHERE temperature < 72 AND temperature > 46 ) SELECT wa.win_rushplays_prop_avg ,wl.win_rushplays_prop_low ,la.los_rushplays_prop_avg ,ll.los_rushplays_prop_low FROM win_low wl JOIN win_avg wa JOIN los_low ll JOIN los_avg la;
Winners Losers
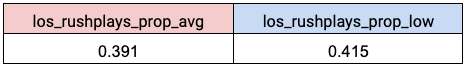
The rushing plays proportion data also seems to support the belief that teams rely more heavily on the run in extremely low temperature games as compared to average temperature games. Using the temperature_score_data table, we are able to observe increases in rushing plays proportions from 0.516 to 0.528 for winning teams and from 0.391 to 0.415 for losing teams.
It is interesting that in extremely low temperature games and average temperature games, winners seem to have a disproportionately high proportion of rushing yards and rushing plays compared to losers. Teams who have leads late in games are said to have a tendency to run the ball more, in order to drain the clock and give the trailing team less time to take the lead. Teams who are trailing late in games are said to have a tendency to pass the ball more, in order to cover more ground and utilize various clock stoppage benefits. In a separate analysis, with play level data, it would be interesting to look into this idea and see if we could find more evidence to support this.
Low Temperature and Total Points
An extremely low temperature often results in a low scoring game -- or at least that's what I grew up hearing. If this is in fact true, I expect to see a lower average total points value in extremely low temperature games than average temperature games.
WITH low_temp_points AS ( SELECT AVG(home_score + visitor_score) AS total_game_points_low FROM temperature_score_data WHERE temperature < 29 AND temperature <> 0 ), avg_temp_points AS ( SELECT AVG(home_score + visitor_score) AS total_game_points_avg FROM temperature_score_data WHERE temperature > 42 AND temperature < 72 ) SELECT * FROM avg_temp_points JOIN low_temp_points;
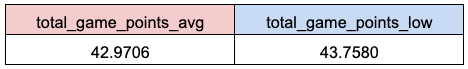
The above data does not seem to support the belief that extremely low temperatures lead to low scoring games. We did not observe a lower average total points value in extremely low temperature games than average temperature games. Instead, in our temperature_score_data table, we actually observed a higher average total points value in extremely low temperature games than average temperature games.
Project Summary
Using the box_scores and game_weather datasets from Kaggle, we were able to find supporting evidence for several commonly held beliefs among NFL fans and unable to find supporting evidence for others.
From the 12,284 games in the union_nfl_data table -- a table formed by all unique games from box_scores and game_weather -- we can see that home teams won 57.11% of the time, away teams won 42.08% of the time and ties occurred less than 1% of the time. This is a significant difference and shows that home teams were 1.36 times more likely to win an average game than away teams were. However, we were unable to find any evidence to support the belief that east coast teams have an additional home field advantage when hosting west coast teams -- despite an attempt to control for team strength using season win percentages.
Total scoring fluctuated considerably in the NFL between 1960 and 2017 and whether or not we can provide supporting evidence to support the belief that total scoring has increased over time depends greatly on the specific time frame we are concerned with. If we model the linear relationship between average game totals and season, we see that the relationship is fairly weak (R-squared of 0.111) from 1960 to 2017. However, using that same model with more recent date ranges, we notice a much stronger correlation between average total points and season: R-squared of 0.717 from 1990 to 2017, and R-squared of 0.637 from 2000 to 2017. It would be reasonable to assume that most NFL fans are not comparing today’s NFL with the NFL from 1960, and therefore the more recent date ranges are probably more relevant to the topic at hand. Under this assumption, we can provide evidence to support the commonly held belief that total scoring has increased over time.
The competitiveness of NFL games -- as defined by average scoring differential -- has not shown a consistent trend over time in our union_nfl_data table. From the 1960s to the 1980s, we can observe an overall decrease in average scoring differential, signaling a more competitive game on average. However, as we move from the 1980s to 2010s, we no longer see that overall decrease in average scoring differential occurring. Under the same assumption of relevant date range discussed in the prior paragraph, we can not provide evidence to support the commonly held belief that games are more competitive now than in recent decades.
In our box_scores dataset, we observed that teams seem to be more reliant on the pass than the run in recent years. Both of the variables we studied, passing yards proportion and passing plays proportion, show relatively consistent increases from 2001 to 2017. If we model the linear relationship of each of the variables independently with season, we observe a strong R-squared value for each: 0.778 for passing yards proportion and 0.712 for passing plays proportion.
Also in our box_scores dataset, we found evidence that seems to support the belief that teams have a tendency to run the football more in games with extremely low temperatures. The average proportion of rushing plays and the average proportion of rushing yards, both increased in games with temperature in the bottom 5% of the range as compared to games with temperatures in the middle 50% of the range. These increases were observed both in winning teams and losing teams. However, we were unable to find evidence to support the belief that extremely low temperatures lead to low scoring games.